DICOM Parametric Maps
Most AI heat maps that reach a radiologist today arrive as a picture. Somebody took the model's saliency output, coloured it red-yellow, pasted it over the CT slice, and saved the result as a new image. It looks fine on screen. It is also a dead end, because nobody can read a number off it, turn it off, or change how strongly it is blended. (This is the same burned-in habit we argued against in Stop burning AI into the image.)
DICOM has a proper object for this, the Parametric Map. Herman Oosterwijk wrote a short, clear deep dive on DICOM Parametric Maps in August, walking through the header of a real ADC map. I recommend reading it alongside this post. Here I want to cover the parts that matter to people building and buying viewers: what the object is, why secondary capture is the wrong habit, and what "displaying it properly" should mean.
What a parametric map is
A normal CT or MR image stores what the scanner measured, more or less: attenuation, or signal intensity. A Parametric Map stores something derived. Each pixel (or voxel) holds a value that means something physical or statistical, such as:
The Parametric Map IOD (PS3.3 A.75) is an enhanced multi-frame object with its own SOP Class (UID ending 4.1.1.30). The standard allows the pixel values to be integer or floating point. That float option is the important bit for AI. A model's probability output is naturally a float between 0 and 1, and you can store it as exactly that instead of squashing it into 0 to 255.
The other key piece is the Real World Value Mapping, which tells the viewer how to turn the stored number into the real quantity and its units. Herman's summary of the display rule is the one to remember:
On the display rule
"…the pixel values must be presented as encoded in the applicable sequences to provide real-world values."
In plain terms, the viewer should show "ADC 0.78 x 10⁻³ mm²/s" when you hover, not "pixel 312".
Why not secondary capture
Secondary capture is the screenshot route: a new RGB image with the heat map burned in. I understand why it is common. Every PACS can store and show it, and the AI vendor does not need the viewer's cooperation. But for a heat map it throws away almost everything useful.
| Secondary capture with burned-in colour | Parametric Map | |
|---|---|---|
| Values | Gone; only colours remain | Stored per voxel, integer or float, with units |
| Toggle on/off | No, it is a separate image | Yes, as an overlay |
| Change opacity or colour scale | No | Yes, viewer-controlled |
| Hover to read a value | No | Yes |
| Alignment with source series | By eye | Through the Frame of Reference and image position |
| Use in other tools | Practically none | Can be re-analysed or compared later |
There is also a quieter clinical problem. Once the colours are baked in, the AI vendor has decided the colour scale and threshold for every radiologist. A low-probability region that the vendor chose not to colour simply does not exist on that picture. With a parametric map, the radiologist can lower the threshold and look.
How a viewer should show it
The IHE AI Results (AIR) profile lists Parametric Map among the object types an AIR display must support. Herman summarised the AIR display requirements in a separate article, and we went through the full list in The AI results checklist we hold our viewer to. For parametric maps, the display should be able to:
- Show the map alone as a colour image
- Identify the source images the map was derived from
- Show the relevant DICOM metadata
- Superimpose the map on the underlying images, following the DICOM pixel pipeline
- Let the user control the blending, and resample one or both datasets when the grids differ
It suggests, without requiring, handling maps that are not aligned with the image axes, and using the Blending Softcopy or Advanced Blending Presentation States when present.
A Parametric Map stays a separate layer with real values, blended over the source images.
From an engineering point of view, here is what we look for when we think about a good implementation.
Two layers, not one picture. The underlying CT or MR stays a greyscale layer with its own window/level. The map is a separate layer with its own colour lookup table and opacity. Changing one should not touch the other.
Real values in the pipeline. The colour scale should be driven by the real-world values, not by raw stored integers. If the map is a probability from 0 to 1, the colour bar should read 0 to 1.
A visible colour bar and threshold. A heat map without a legend is a decoration. The radiologist should see what red means and be able to hide everything below, say, 0.3.
Resampling that is honest. AI maps are often lower resolution than the source. Interpolating smoothly makes them look more precise than they are. I would rather see the blocky truth, or at least have the option.
Algorithm identity on screen. AIR asks for the algorithm name, version and manufacturer to be shown for each result. With heat maps this matters more than usual, because different models produce very different-looking maps for the same study.
PET SUV maps: the same idea, older
If you have read PET/CT, you have already used something very close to a parametric map. PET images are usually stored as activity concentration, and the PET Series Module (PS3.3 C.8.9.1) carries the units, the SUV type and decay correction details. The viewer takes those, plus the patient weight, injected dose and timings in the header, and turns pixels into SUV. Herman lists SUV maps as a common parametric map use too.
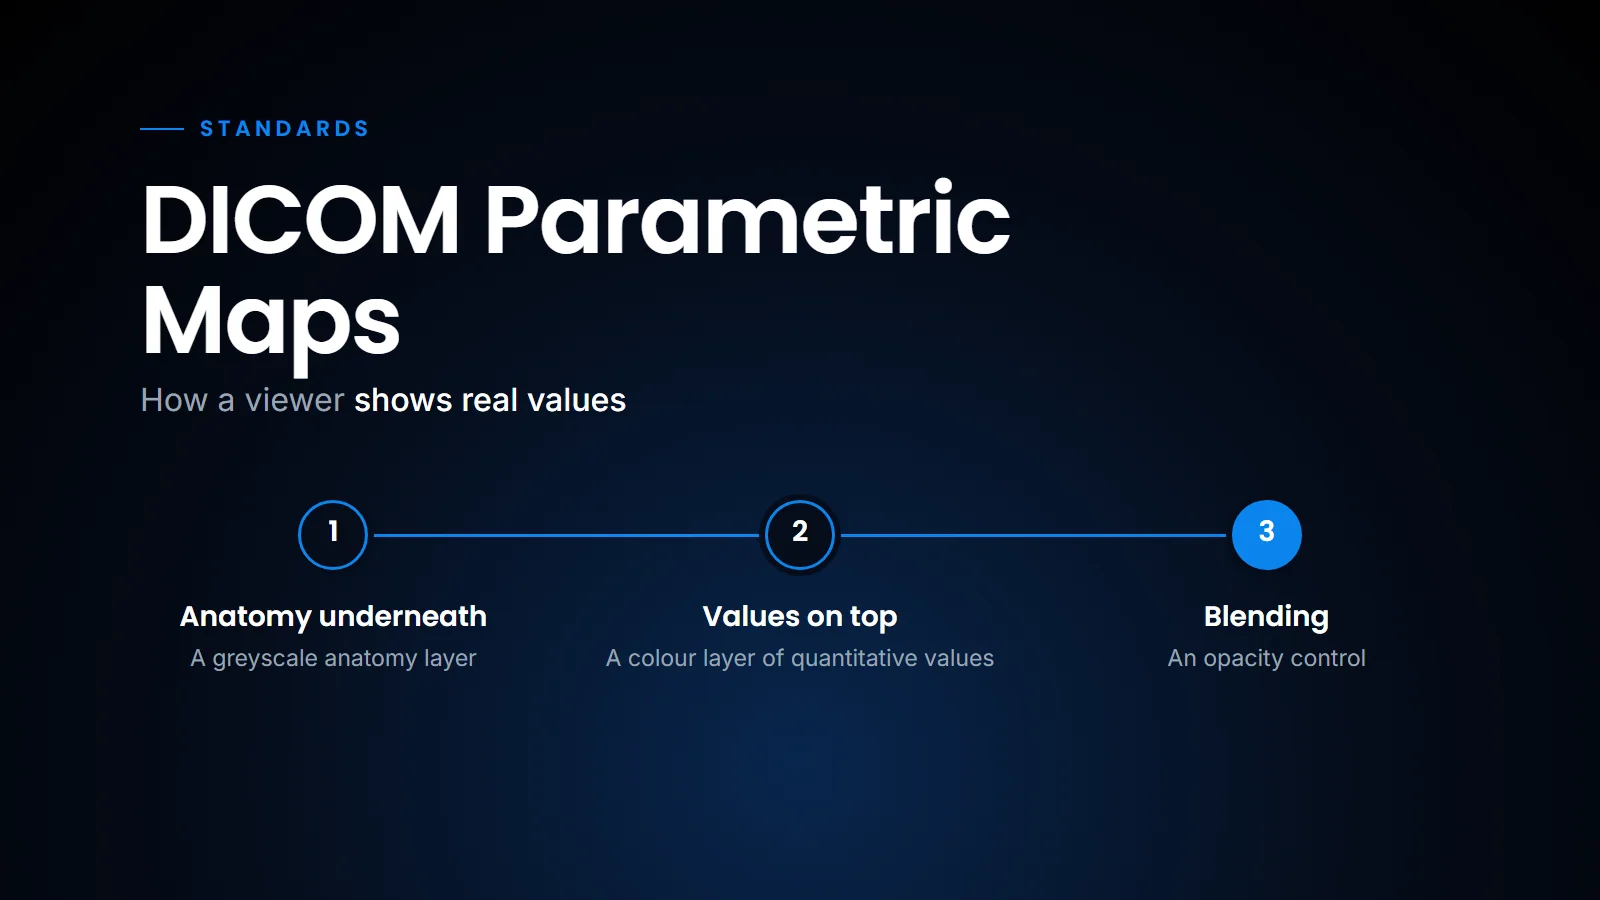
PET/CT fusion in our browser viewer is the same rendering problem that a parametric map overlay poses. A greyscale anatomy layer underneath, a colour layer of quantitative values on top, an opacity control, and a value you can read under the cursor.
What PET fusion and a parametric map overlay both need
We also do threshold-based 3D lesion segmentation on PET in the browser, and a threshold only makes sense if the numbers behind the colour are real. (We described that workflow in Reading PET/CT in the browser.)
That is why I think the step from PET fusion to AI heat maps is smaller than people assume. The hard part, a viewer that respects real values and blends two grids correctly, is already needed for PET. The parametric map object just gives AI output the same respect.
What this means for a centre
If an AI vendor offers heat maps, ask in what form they arrive. If the answer is "a secondary capture series", accept it as a stopgap, but ask when a Parametric Map output is planned. And test your current viewer with a sample Parametric Map before assuming it can show one. Many viewers will store it without complaint and then display a grey, meaningless image.
It also helps to know which object fits which output. A heat map or other quantitative map is a Parametric Map; a region is a SEG, including a probability of belonging to that region, which FRACTIONAL SEG can carry (see DICOM SEG or RTSTRUCT); a measurement or finding that should reach the report is an SR. An AI product that produces all three should not squeeze them into one screenshot.
The practical upshot is that a parametric map is not an exotic object. It is the same "real values under a colour layer" idea that PET viewing has relied on for years, applied to AI output. The advantage is that the radiologist keeps control of the threshold, the blending and the numbers; the disadvantage, for now, is that installed viewers are uneven in how well they display it. That is why I suggest accepting secondary capture only as a temporary arrangement, and testing for Parametric Map support whenever you evaluate a viewer or an AI product.
Related reading
- The AI results checklist we hold our viewer to — the IHE AIR display requirements, object by object.
- Stop burning AI into the image — why presentation states beat burned-in annotations.
- DICOM SEG or RTSTRUCT: which format for AI segmentations? — the right objects when the AI output is a region.
- Reading PET/CT in the browser — fusion, SUV and threshold segmentation in a zero-footprint viewer.
- DICOM headers and AI routing — the metadata a viewer and an AI pipeline both depend on.
FAQ
What is a DICOM Parametric Map?
It is a multi-frame DICOM image where each pixel holds a derived, real-world value, such as ADC, perfusion, SUV or an AI probability, instead of raw scanner signal. The values can be integer or floating point.
Why not just use secondary capture for AI heat maps?
Secondary capture burns colours into a new image. You lose the actual values, you cannot turn the overlay off or change its opacity, and the vendor's colour threshold becomes fixed for every reader.
What does IHE AIR require for displaying parametric maps?
The display must show the map alone as a colour image, identify its source images, show relevant metadata, superimpose it on the underlying images per the DICOM pixel pipeline, and let the user control blending.
Is a PET SUV image a parametric map?
SUV maps are a common parametric map use. Standard PET images store activity concentration, and the viewer converts it to SUV from header data, which uses the same idea of real values behind the colour.
Ready to see your workflow on one platform?
We will walk you through the whole workflow, from registration to signed report.